|
CMIP6精细化气候预测新时代:中国10公里分辨率多变量每日数据集正式发布——Scientific data最新研究解读
当前全球气候变暖背景下,极端天气频发,区域水文、农业和生态系统面临严峻挑战。
近日,为了更高精度地支持区域气候适应性规划与碳中和路径设计,中科院地理科学与资源研究所的Fuyao Zhang等研究团队于Scientific data期刊发布了重要成果:基于CMIP6气候模型与深度残差注意力机制,构建出中国10公里分辨率的多变量日尺度气候与潜在蒸散发(PET)数据集,命名为 SRCPCN10。
英文题目:CMIP6-driven 10 km super-resolution daily climate projections with PET estimates in China
中文译名:CMIP6驱动的中国10公里超分辨率每日气候预测及PET估算
发布时间:2025年4月30日
发表期刊:Scientific data第一作者:Fuyao Zhang et al
第一单位:中科院地理所
DOI:10.1038/s41597-025-05071-z
要点解析
1、打造10公里级全国多变量气候预测数据集SRCPCN10
本研究通过Residual Channel Attention Network(RCAN)模型,将CMIP6多源气候数据下采样至10公里空间分辨率,显著提升了气温、辐射、气压等变量的精度(R²/KGE > 0.99),是目前国内外分辨率最高、精度最优的公开数据集之一。
针对潜在蒸散发(PET)进行高精估算,填补了该变量在大气-生态-水文建模中的长期尺度空白。
2、高逼真度呈现未来气候变化情景(SSP1–SSP5)下的空间响应
不同SSP排放路径下,研究揭示了中国区域在气温、辐射、降水等气候要素上的梯度响应规律,为预测极端气候频率变化和评估农业气象风险提供了科学基础。
3、适配多种场景,服务多个应用领域
SRCPCN10特别适用于流域水文模拟、农业产能评估、气候风险管理、生态系统响应预测等场景,极大拓展了CMIP6模型在区域决策支持中的实用性。
主要发现
1、气温/辐射/气压变量下采样精度优异,降水存在空间不连续挑战
通过RCAN模型,气温、辐射与气压的R²与KGE均超过0.99,降水因空间异质性较大,R²为0.897。
此差异表明在未来精细化建模中,降水等高变异变量需引入地形、季节性因子增强约束条件。
2、原始CMIP6与下采样数据高度一致,变化趋势保真性高
年均值对比显示:99%以上的气候指数差异小于1%,确保模型输出在保持原始趋势基础上具备更高空间解析能力。
3、提供逐日尺度PET估算,有效支撑碳通量与水资源平衡研究
PET作为水文与碳交换研究的核心输入,其日尺度、高空间分辨率估算将极大提升生态-水文耦合模型的可信度。
研究总结
本研究突破了传统气候模型空间分辨率低、变量不全、数据整合难的瓶颈,首次将CMIP6多模式、多情景气候投影数据以10公里分辨率完整发布,并提供高精度PET估算。SRCPCN10数据集将成为未来中国应对气候变化的重要“数据底座”,为从国家气候战略到区域风险防控提供坚实的量化支撑。
该成果不仅具备显著的科研价值,更具现实政策意义,特别是在以下方面:
为流域水资源调控与洪旱预警系统建设提供高分辨率气候输入;
强化农业气象灾害监测与产量模拟的气候基础;
提供碳达峰、碳中和路径下生态系统响应建模依据。
图解科学突破
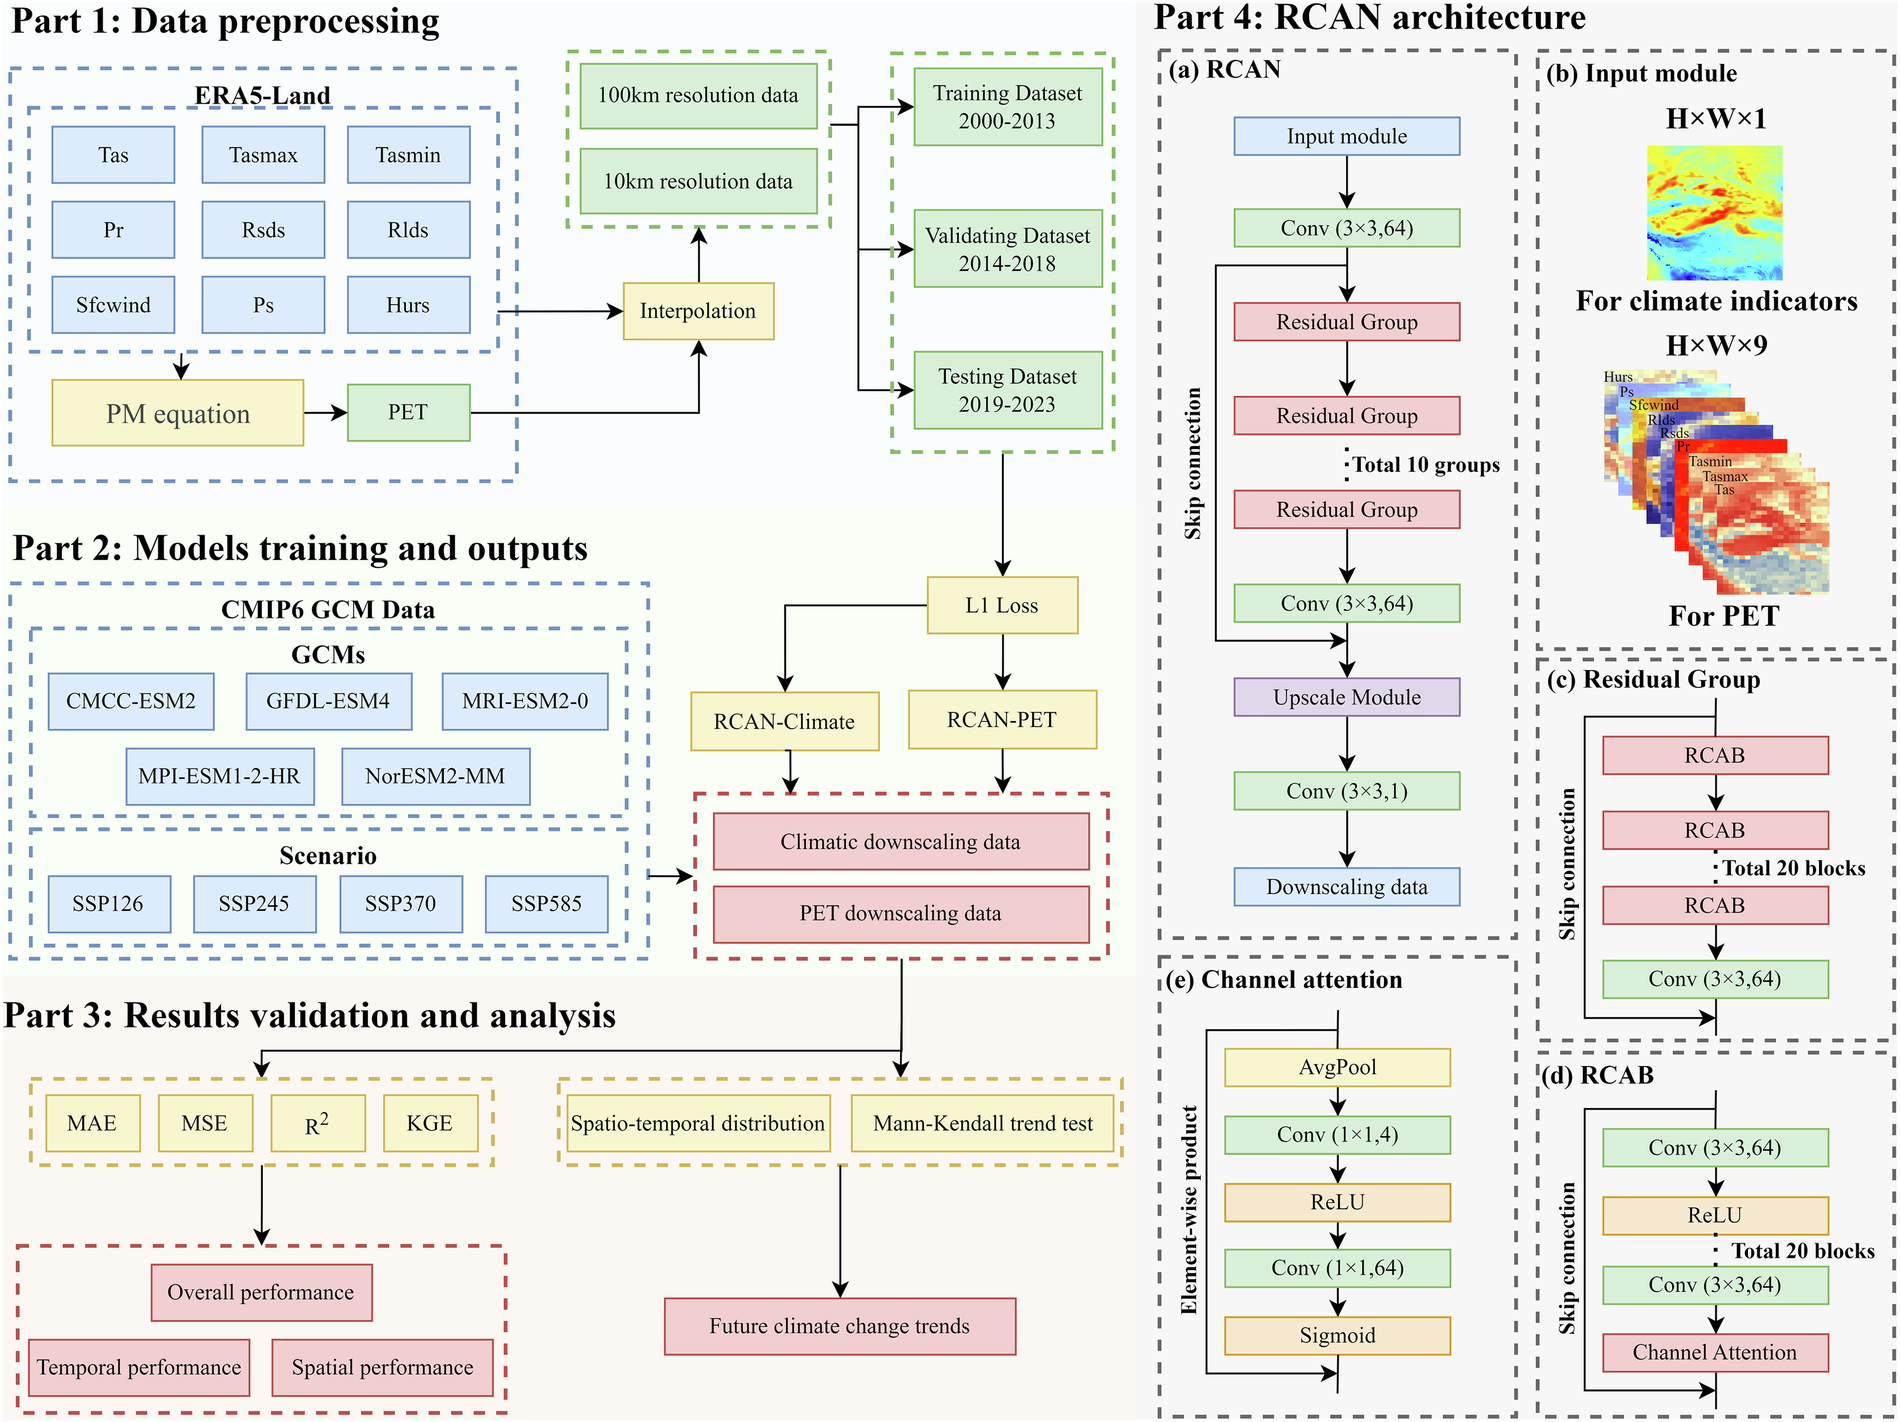
Fig.1 Technical workflow of the multivariate climate-PET coupled downscaling framework based on the improved RCAN. Part 1 is data preprocessing; Part 2 is model training and output generation; Part 3 is result validation and analysis; Part 4 is architectural details of the RCAN model.
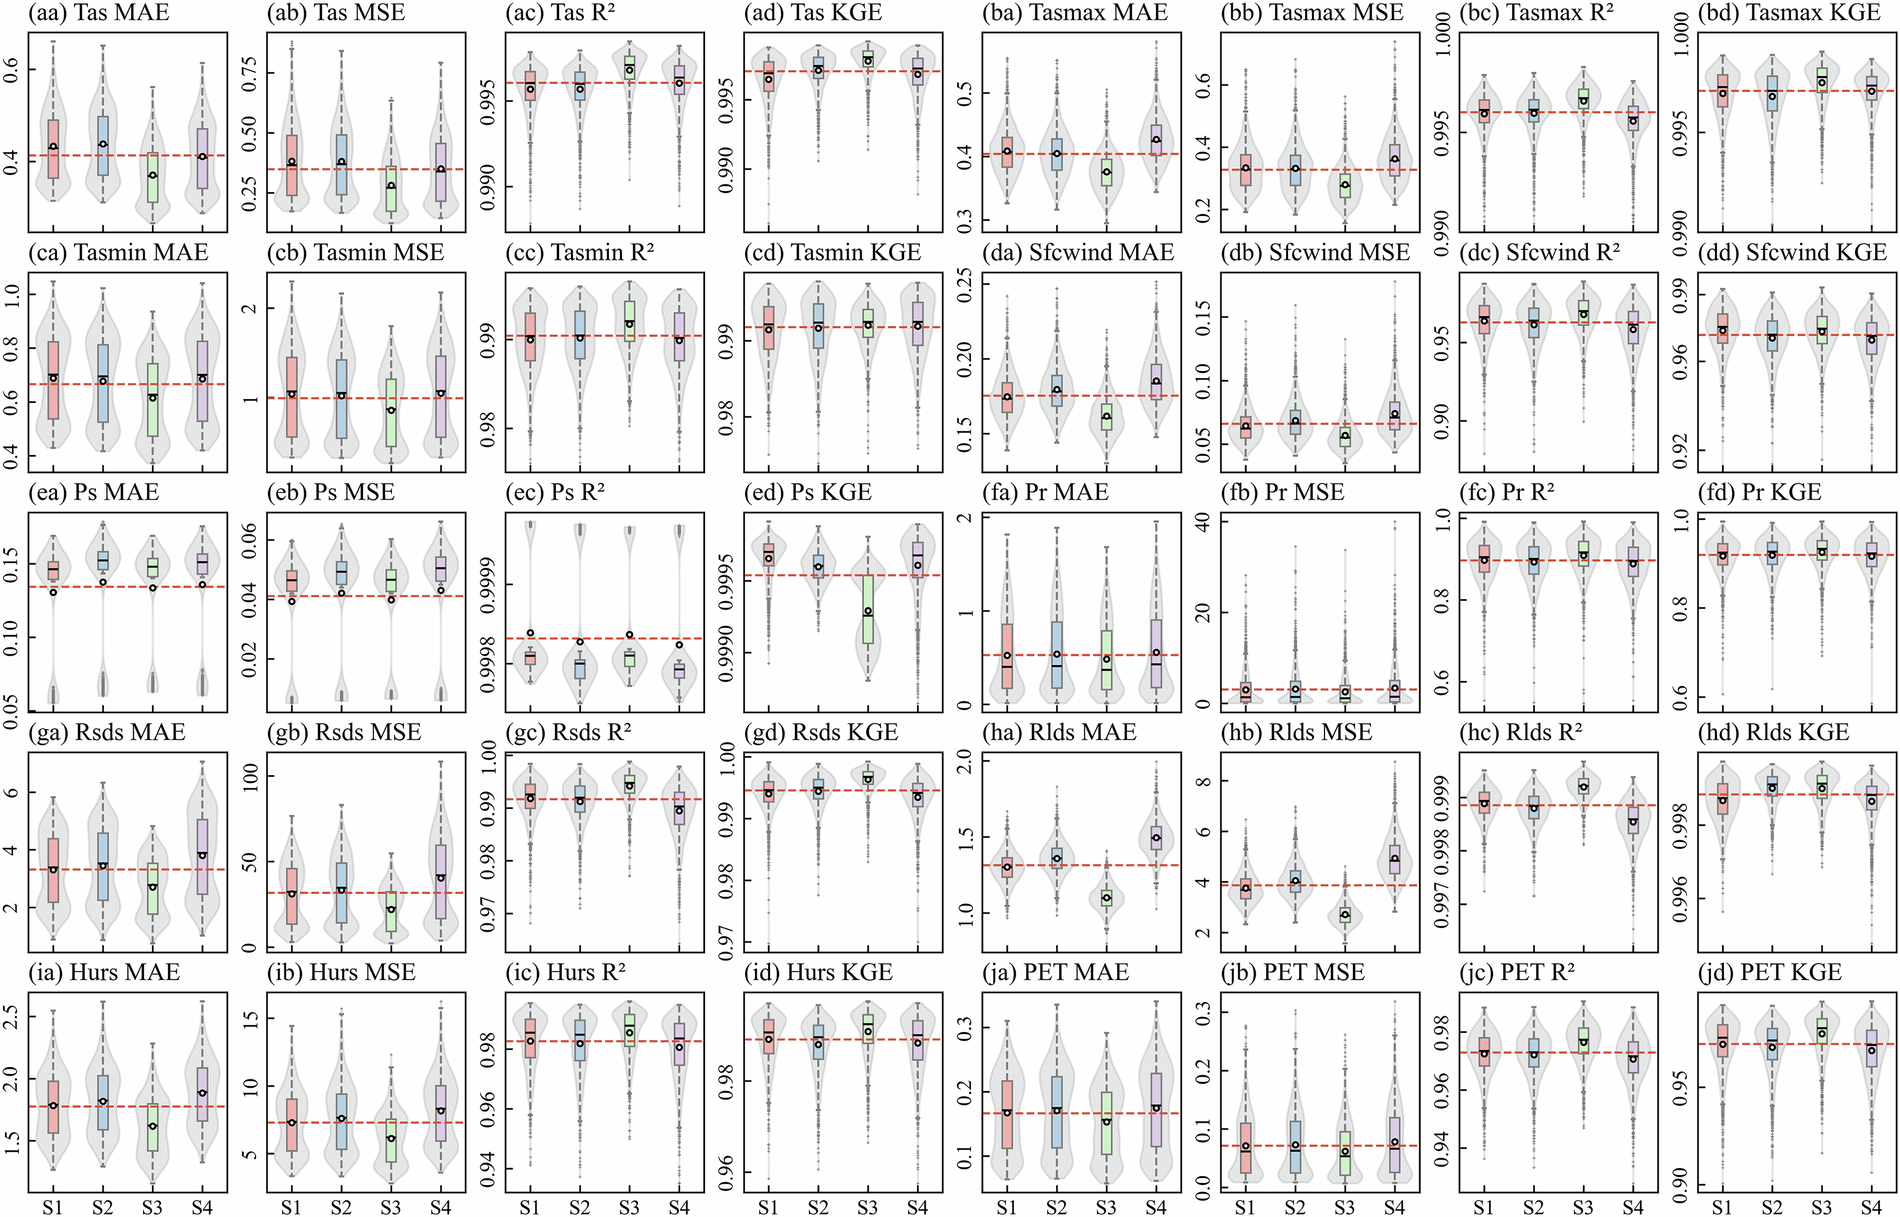
Fig. 2 Box and violin plots of MAE, MSE, R2 and KGE between daily ERA5-Land climate data and RCAN model estimates for: (aa–ad) tas, (ba–bd) tasmax, (ca–cd) tasmin, (da–dd) sfcWind, (ea–ed) ps, (fa–fd) pr, (ga–gd) rsds, (ha–hd) rlds, (ia–id) hurs, and (ja–jd) PET.
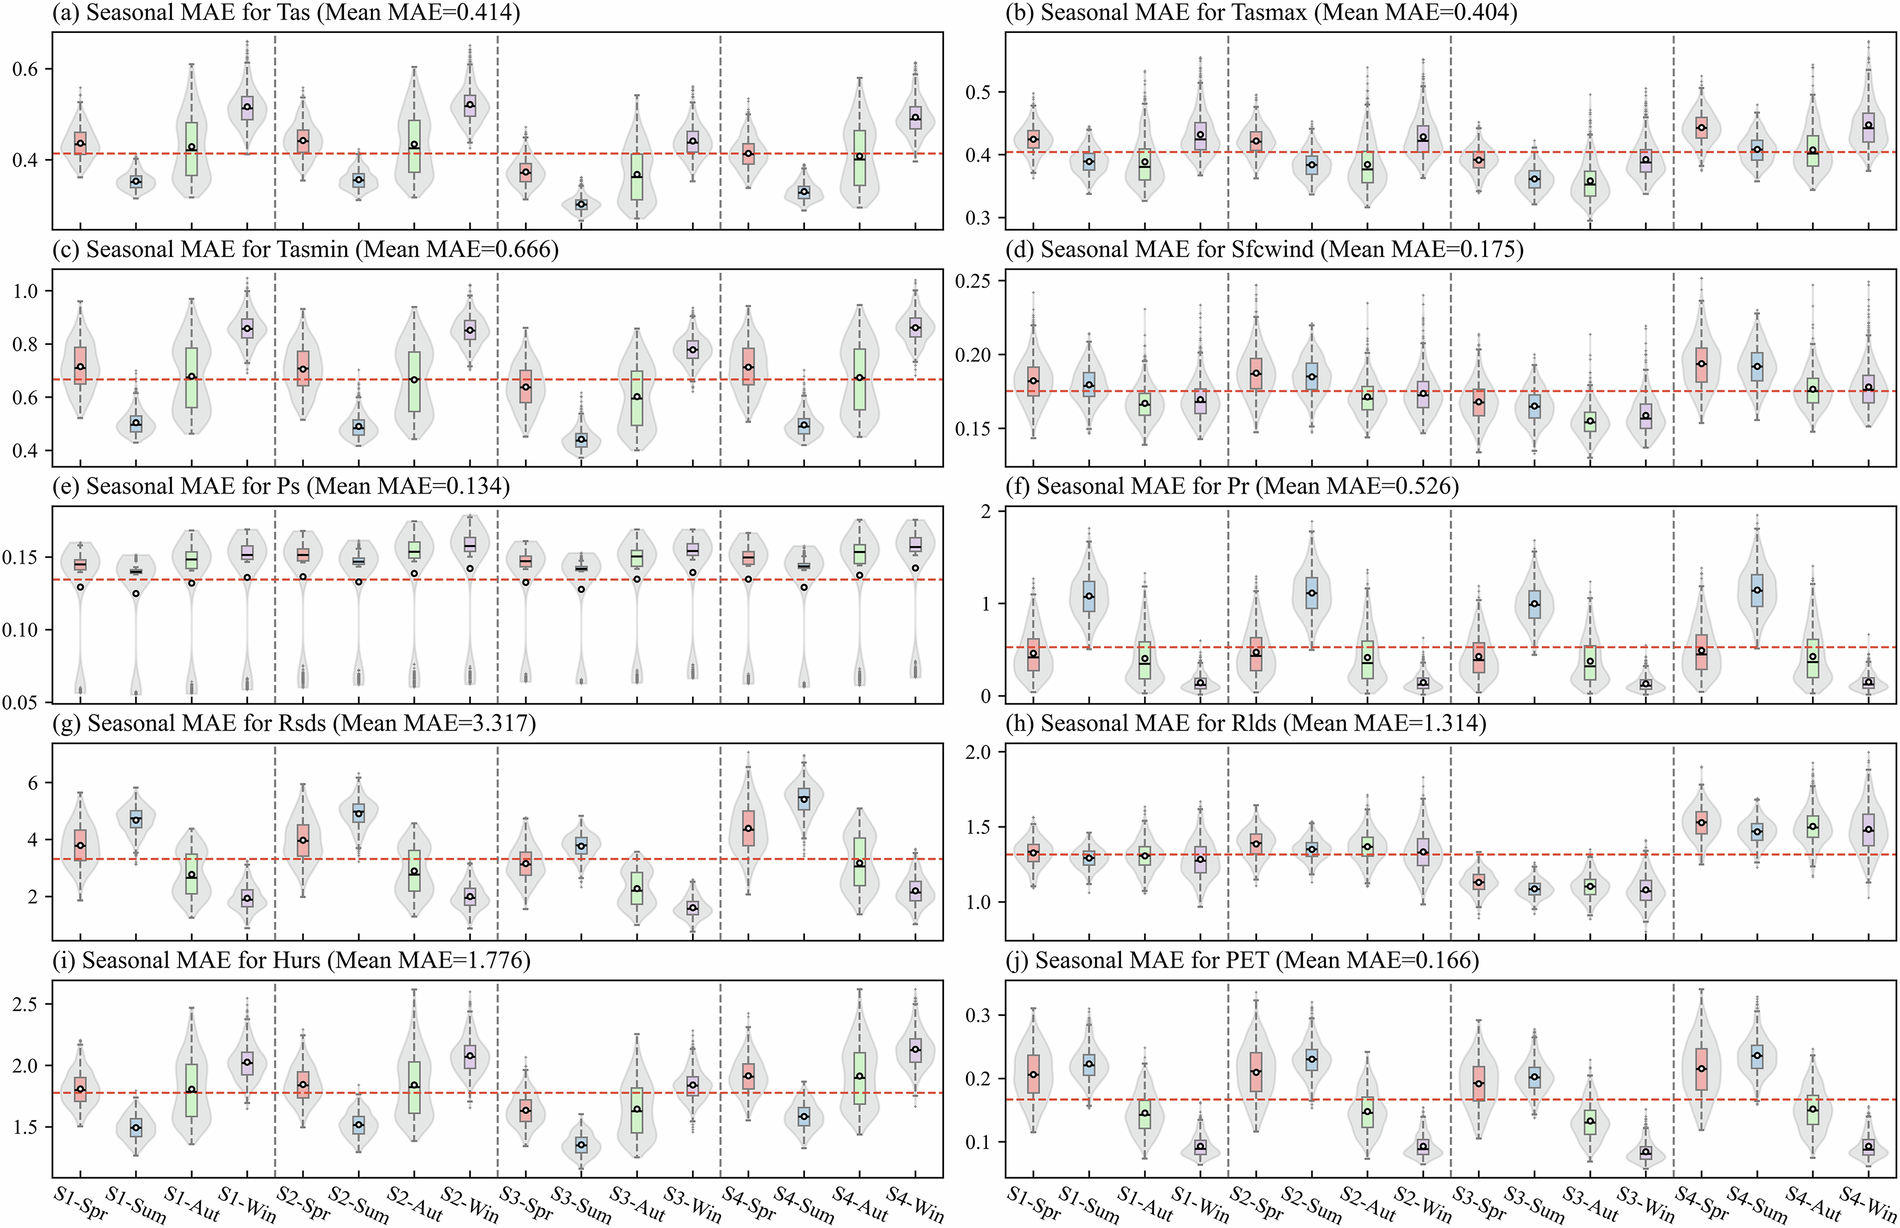
Fig. 3 Seasonal variations in MAE between daily ERA5-Land climate data and RCAN model estimates across China, represented by box and violin plots: (a) tas, (b) tasmax, (c) tasmin, (d) sfcWind, (e) ps, (f) pr, (g) rsds, (h) rlds, (i) hurs, (j) PET. The red dashed line denotes the average MAE value for each metric.
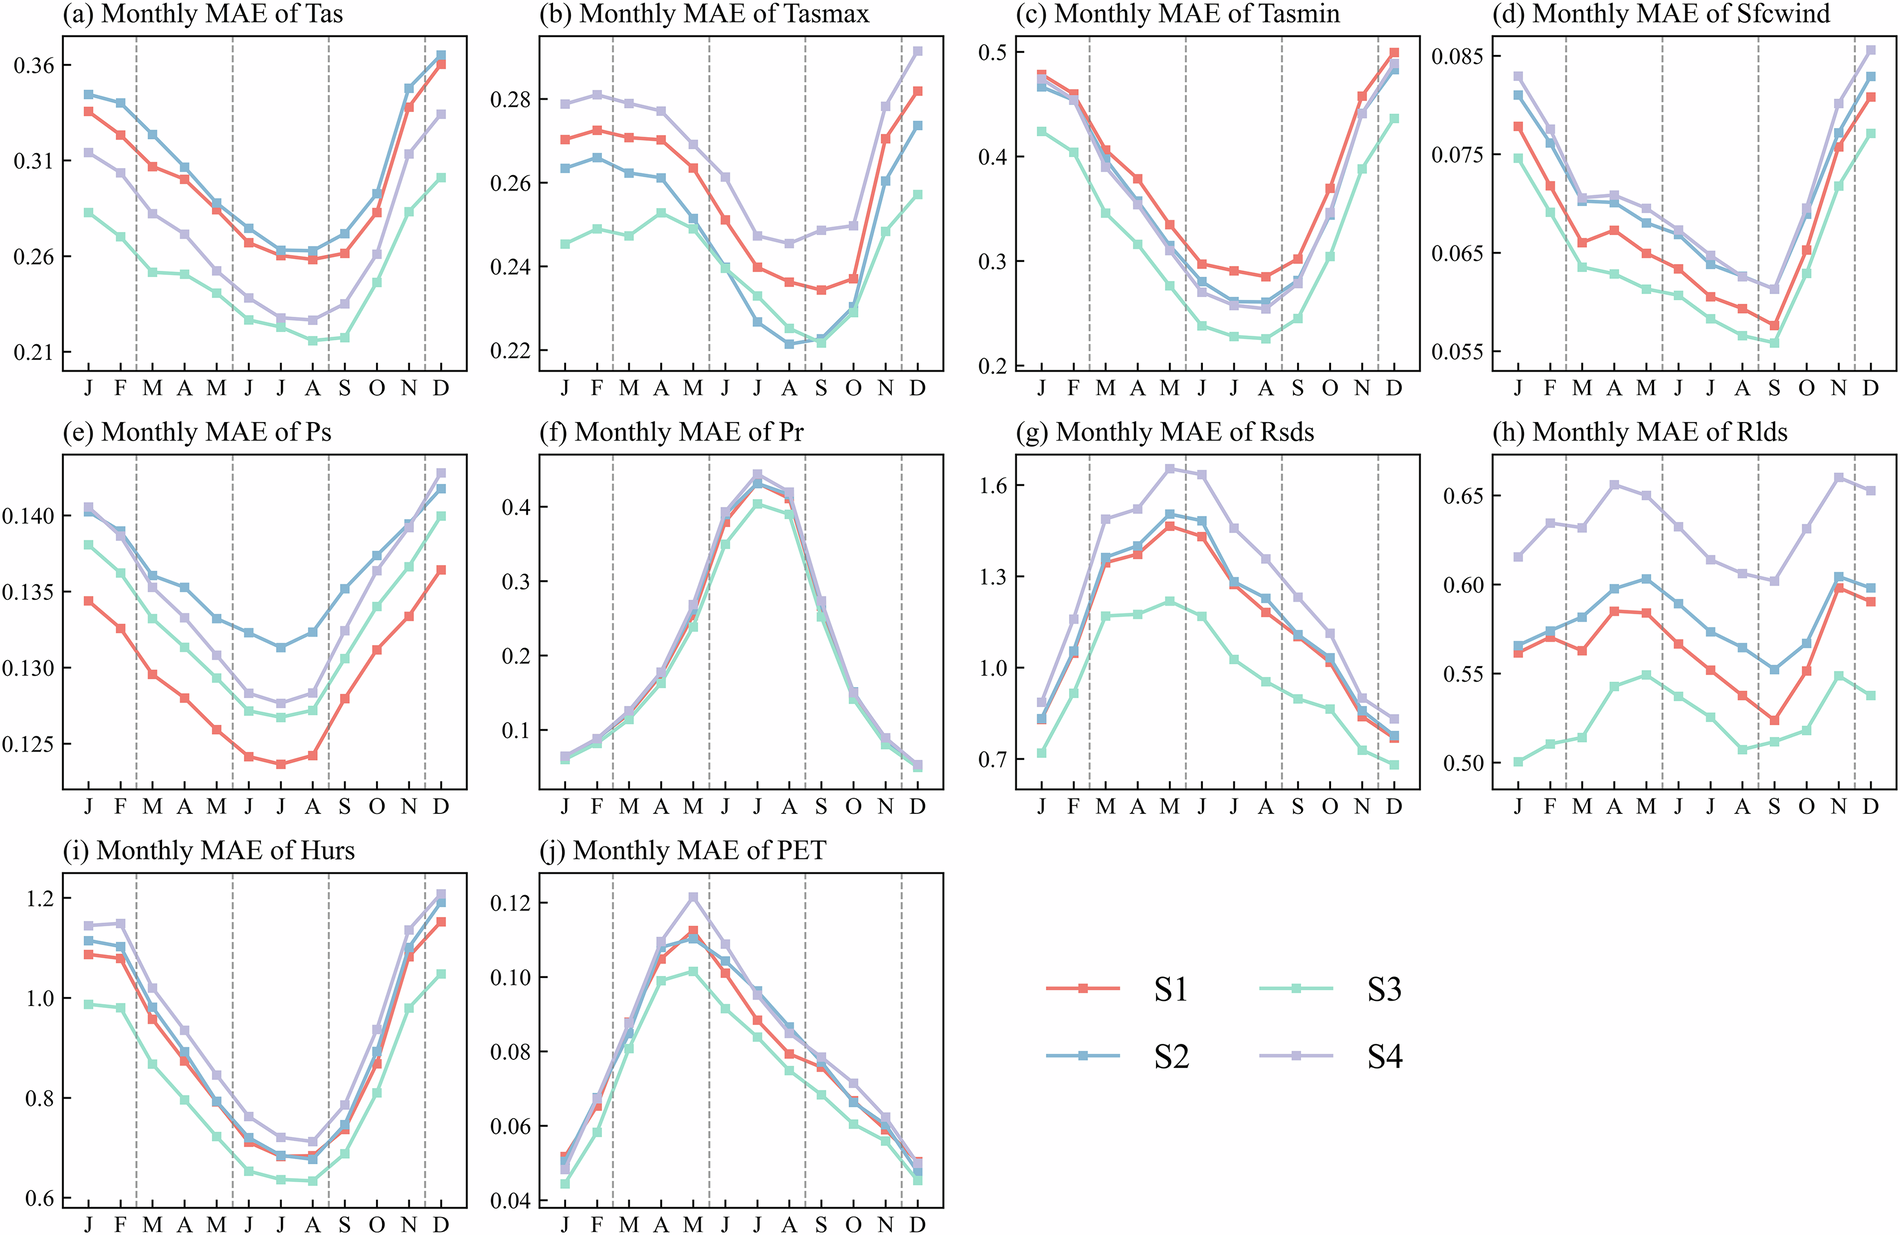
Fig. 4 Comparison of monthly MAE time series for downscaled climate variable estimates across China: (a) tas, (b) tasmax, (c) tasmin, (d) sfcWind, (e) ps, (f) pr, (g) rsds, (h) rlds, (i) hurs, (j) PET. Four polylines illustrate MAE variations across different data resolutions.
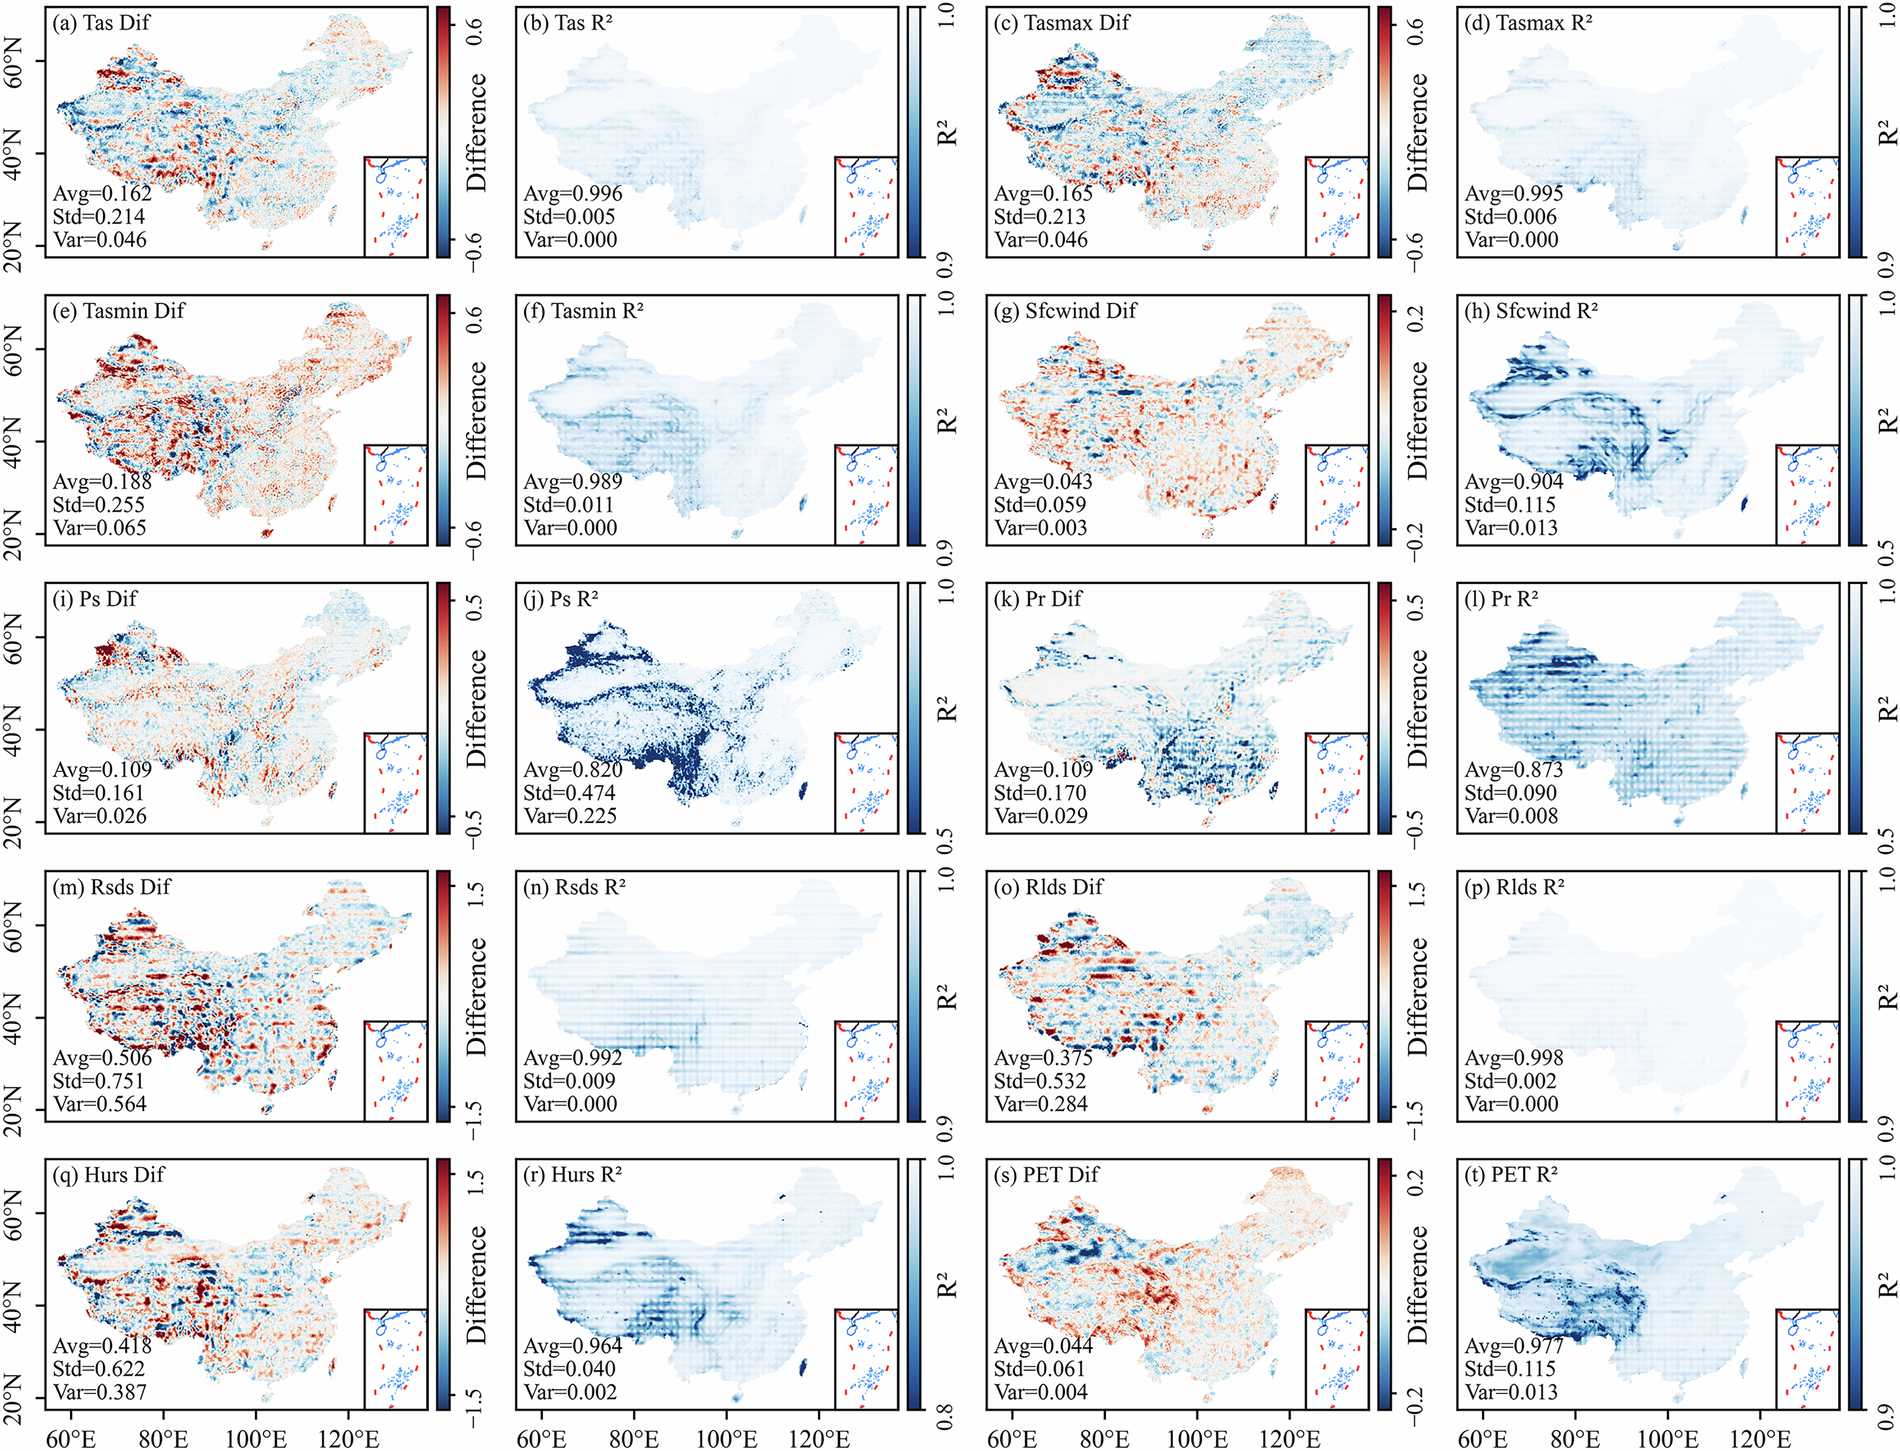
Fig. 5 Spatial distributions of difference and R2 between ERA5-Land climate data and RCAN model estimates. Columns 1 and 3 show spatial patterns of estimation difference for different climate variables, while Columns 2 and 4 display spatial distributions of R2: (a,b) tas, (c,d) tasmax, (e,f) tasmin, (g,h) sfcWind, (i,j) ps, (k,l) pr, (m,n) rsds, (o,p) rlds, (q,r) hurs, (s,t) PET.
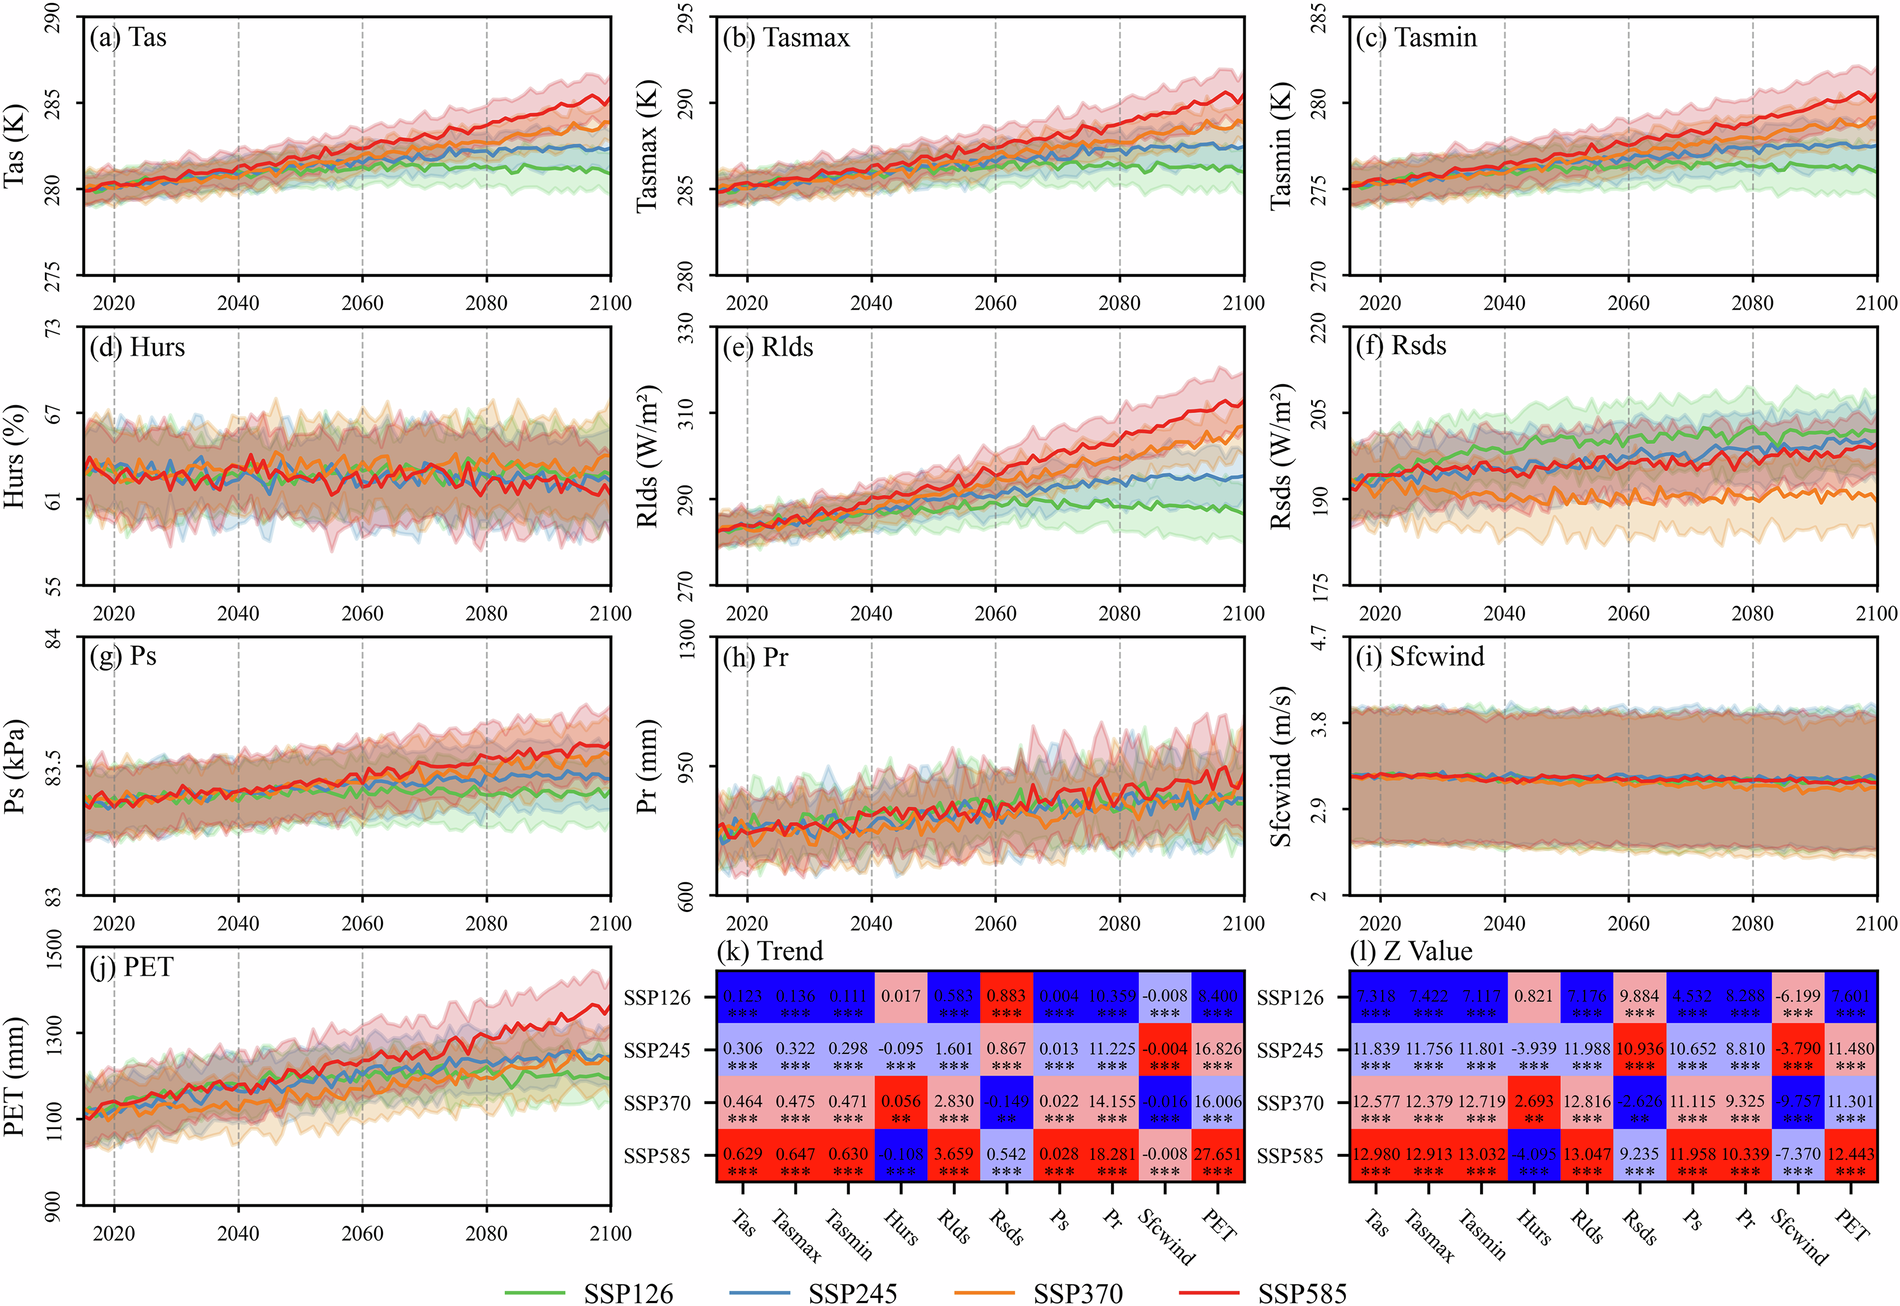
Fig. 6 Temporal variations and statistical significance of annual climate variables over China (2015–2100) under multi-SSP scenarios from a multi-GCM ensemble. (a) tas, (b) tasmax, (c) tasmin, (d) hurs, (e) rlds, (f) rsds, (g) ps, (h) pr, (i) sfcWind, (j) PET. (k) Heatmap of scenario-dependent change rates for all indicators; (l) Heatmap of scenario-dependent Z-values. * denote statistical significance levels.
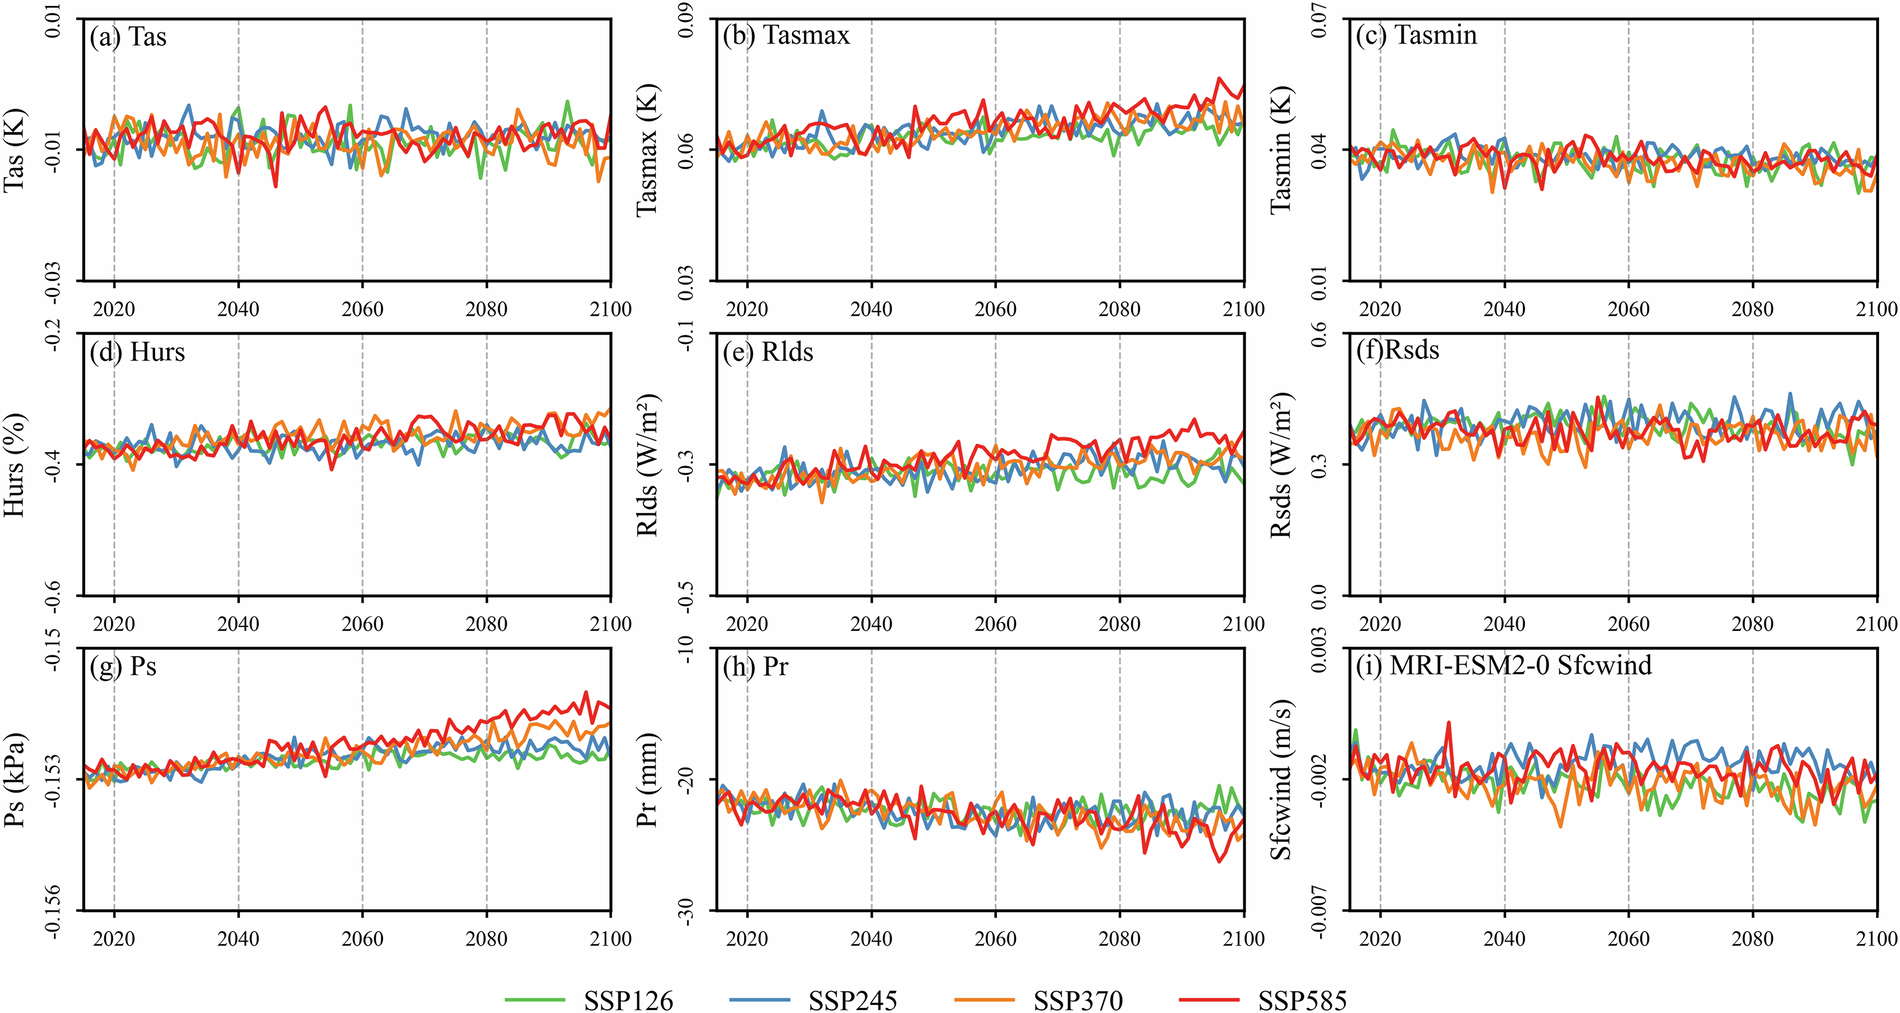
Fig. 7 Time series of differences in annual mean climate variables between the downscaled outputs and the mean original data. (a) tas, (b) tasmax, (c) tasmin, (d) hurs, (e) rlds, (f) rsds, (g) ps, (h) pr, (i) sfcWind.
来源:公众号“地学韦丰吉司长”
| 

 发表于 2025-5-6 10:37:29